Feature · Urban Mobility
From Satellite to Street: We Graded PJU1's Low-Carbon Future
Low-carbon city planning has long been locked behind expensive consultants and government departments. We wanted to know: what if you could grade a neighbourhood’s carbon performance from open data alone, with no six-figure survey required? So we pointed our LCCF Platform at PJU1, a residential section of Petaling Jaya in Greater Kuala Lumpur.
What is the LCCF?
Malaysia’s Low Carbon Cities Framework, developed by the Malaysian Green Technology and Climate Change Corporation (MGTC), is the national yardstick for measuring and cutting a township’s carbon footprint. It underpins the country’s pledge to reduce carbon-emissions intensity 45% by 2030. Cities are where most of Malaysia’s energy is burned and most of its people live, which makes the township the natural unit for climate action.
The framework breaks an area down into four elements: Urban Environment, Urban Infrastructure, Urban Transportation and Buildings. Each is scored across criteria such as greenery, energy efficiency, public transport and green-building certification. A parallel view, used in MGTC’s Low Carbon Cities 2030 Challenge, weighs five pillars by carbon impact: Energy, Mobility, Water, Waste and Greenery. Those scores roll up into a single figure, carbon reduction against a business-as-usual baseline, which translates into a diamond rating, MGTC’s recognition tiers. The more a neighbourhood cuts, the more diamonds it earns, climbing from one to five.
Why we built the platform
A full LCCF assessment has traditionally been a consultant-led exercise: months of manual data-gathering and site visits for a single township, then repeated from scratch for the next. That works for a handful of flagship cities, but Malaysia has hundreds of local authorities, all working toward the same 2030 deadline. We set out to turn a service that scales with effort into a product that scales with adoption. The LCCF Platform automates the data pipeline, drawing on satellites and open maps instead of surveys. It standardises the scoring and puts a living dashboard in front of an authority in days, not months. Build the methodology once; deploy it everywhere.
Why PJU1?
There’s a blind spot in how low-carbon cities get built. Most of the effort, and most green-building recognition, flows to new development: master-planned townships and new green-rated buildings, designed clean from the ground up. But the Klang Valley is running out of greenfield land. Mature districts are effectively built out, pushing fresh development to the fringe, and Kuala Lumpur’s own 2040 structure plan has already flagged 139 ageing sites for regeneration. The real carbon challenge isn’t the next new township; it’s the millions already living in established neighbourhoods that no framework has systematically assessed.
PJU1 is exactly that kind of place. To prove the approach we needed a real, existing area, not a tidy hypothetical. At 85 hectares it’s small enough to validate end-to-end, yet its mix of terrace housing, high-rise condominiums, commercial strips and a river corridor exercises every element of the framework. It has strong open-data coverage, so we could test the no-survey premise honestly. And it’s about to change: with an LRT3 station and a new pedestrian bridge both arriving in June 2026, PJU1 is a live experiment in how a single infrastructure upgrade moves a neighbourhood’s carbon score.
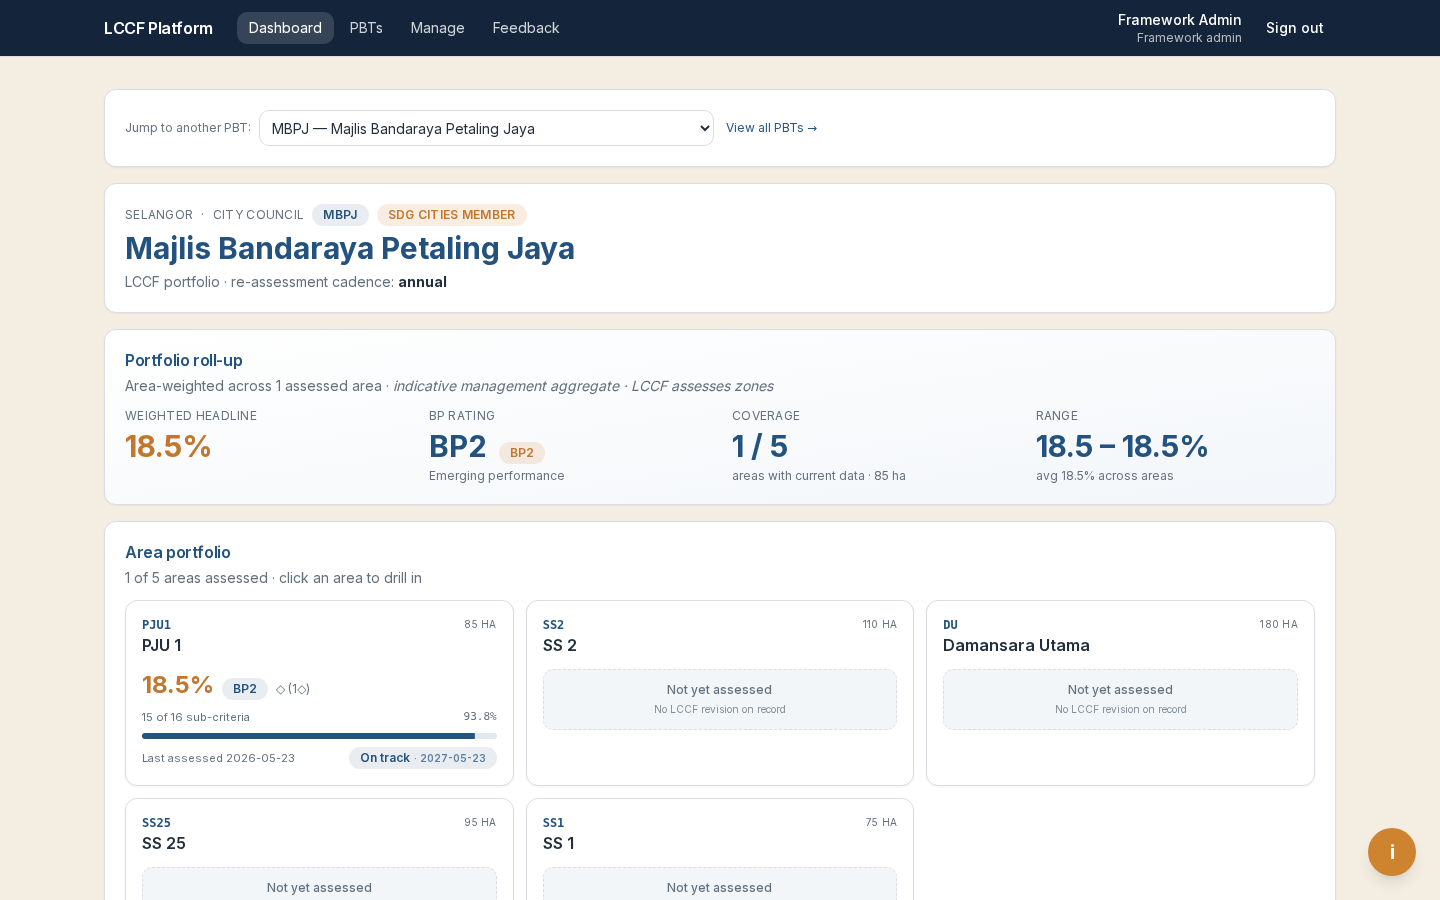
The verdict on PJU1
PJU1 scores 18.5% carbon reduction against business-as-usual, landing in the “Emerging Performance” band. That’s good for a single diamond, and tantalisingly close to the 20% that would unlock the next tier. Every figure came not from clipboards and site visits, but from satellite imagery (Sentinel-2 vegetation data), OpenStreetMap and an automated toolkit built around the LCCF. Across PJU1’s 85 hectares, terrace housing dominates at 55%, leaving barely 5% green space and a thin river corridor along its eastern edge.
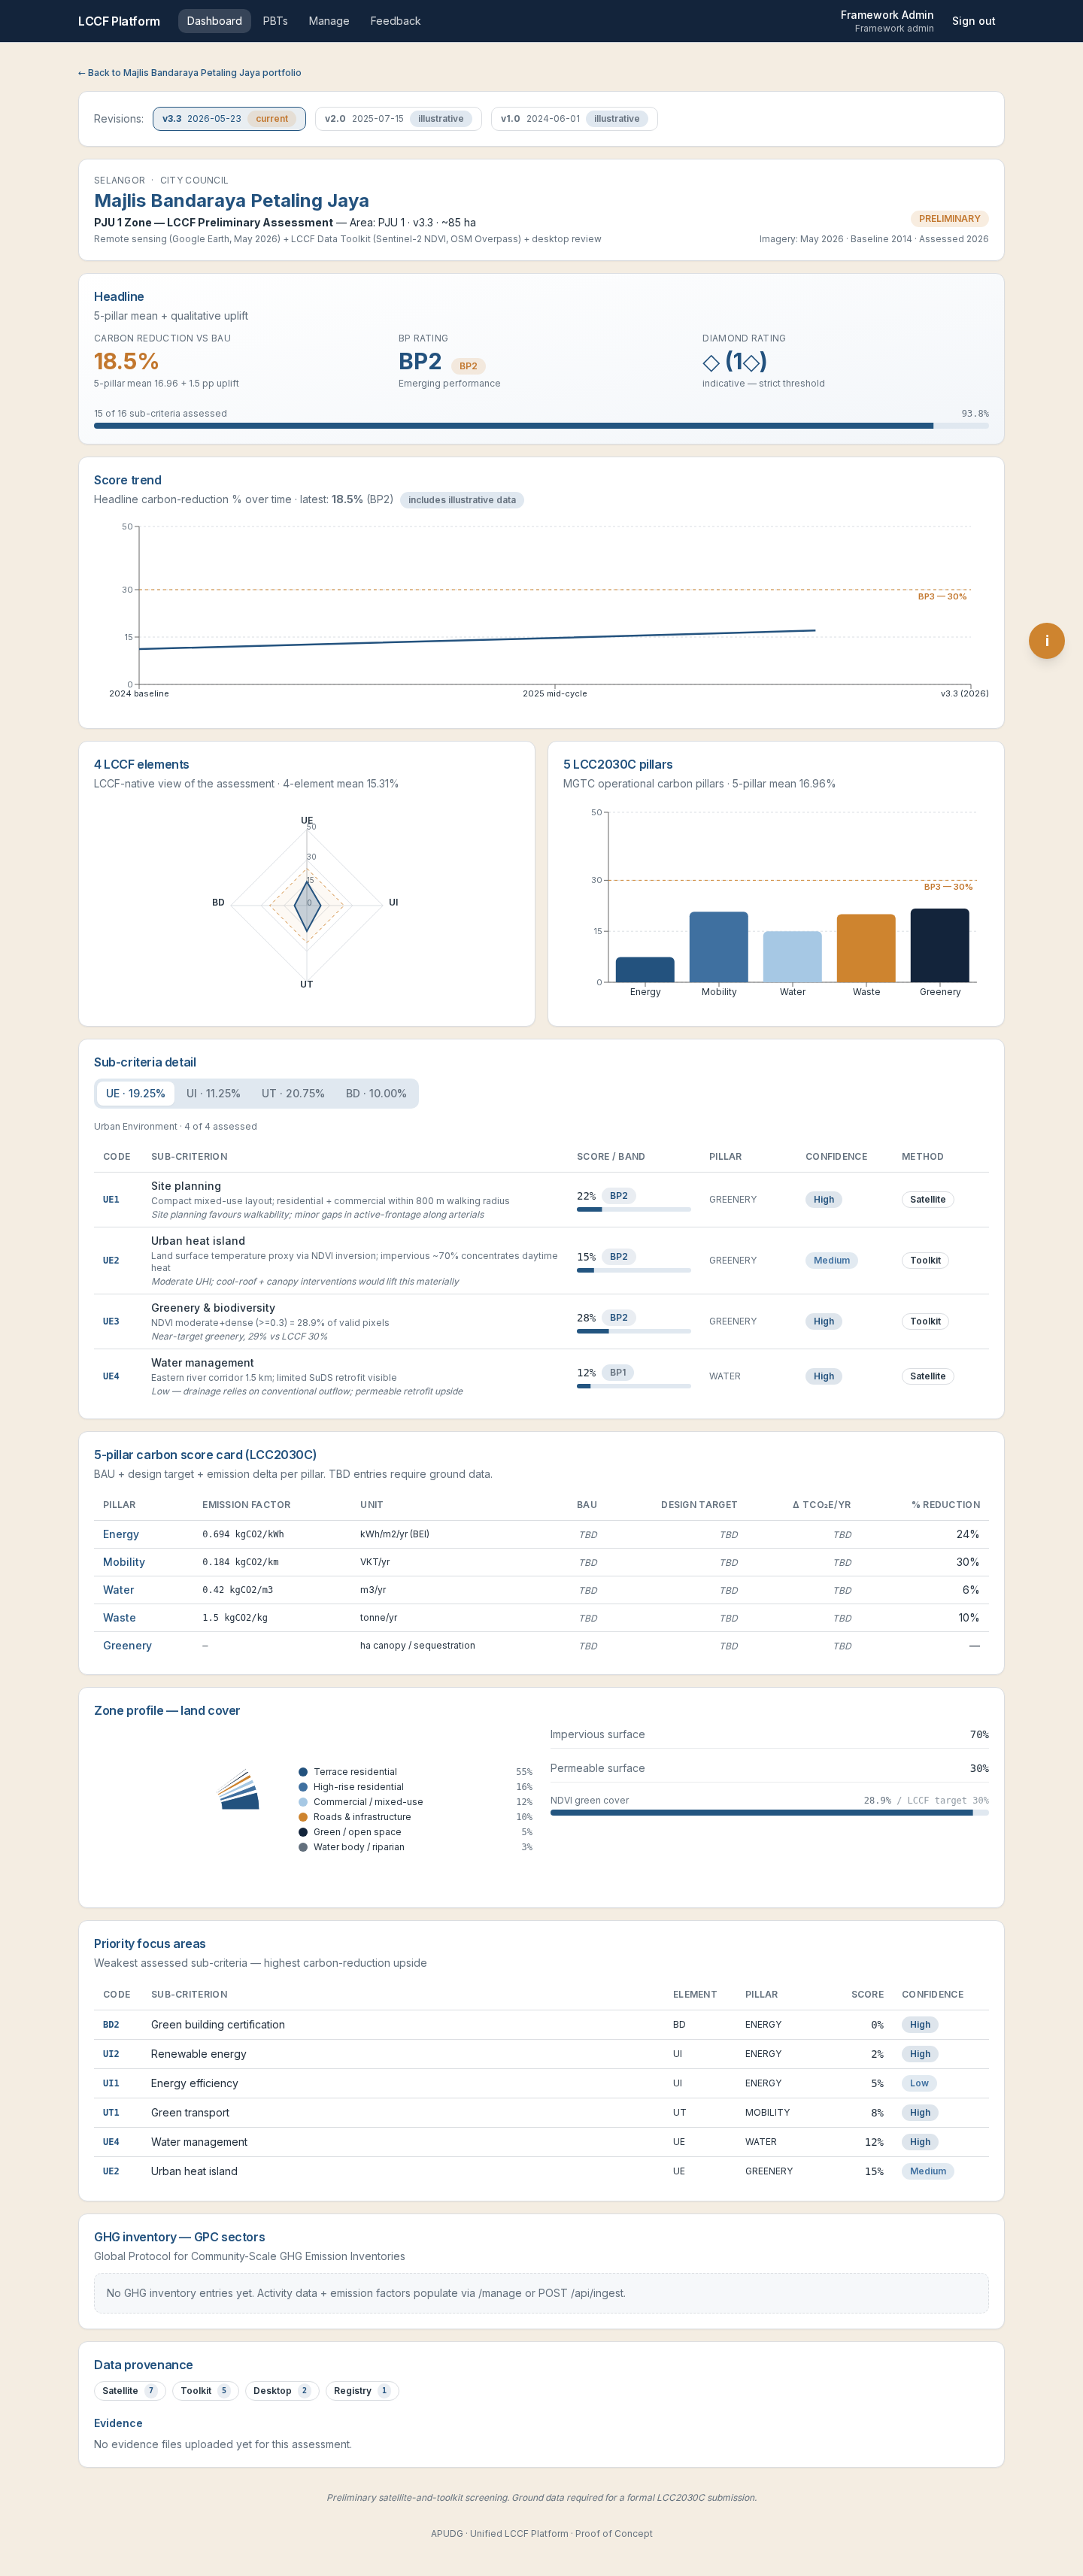
Behind the headline, the four elements tell the real story, and it’s a mobility one. Urban Transportation leads at 20.75%: dense Rapid bus coverage, on-demand services, and, crucially, that incoming LRT3 station and pedestrian bridge. Urban Environment follows at 19.25%. But Urban Infrastructure (11.25%) and Buildings (10%) drag, and the energy pillar bottoms out at just 7.4%, with almost no rooftop solar across that terrace housing and not a single green-rated building.
That contrast of strong transit and weak buildings is exactly the kind of insight a resident association or NGO could act on. Cool-roof coatings on those terrace rows, rooftop solar, street trees threading the river corridor: each maps to a metric the assessment already flags. It’s the raw material for tactical urbanism, the small, community-led interventions that are now pointed by data instead of guesswork.
Opening it up
The LCCF Platform was built for local authorities, the officers and agencies who report on Malaysia’s carbon goals. But we’re now rolling out a self-serve module: upload a map of your area, and the platform generates a preliminary low-carbon analysis automatically. We’re opening it to the public, to the communities and NGOs who care about their own streets but never had access to the metrics. It launches soon at lccf-platform.web.app.
A consulting service scales with effort; a platform scales with adoption. PJU1 is one zone. Malaysia has hundreds of townships, and the SDG Cities network alone counts 80-plus members. If grading a neighbourhood’s carbon future can be this cheap and this fast, there’s no reason it should stay in the hands of a few. The data was always there, sitting in the open. It just needed a way to be read.